


 Warranty Policy
 FAQ
FAQ Download
 Company Events
 Business Events
 Vlog
Vlog Profile
 Why Premteco
 Certificates

 CN
CN EN
EN RU
RU ES
ES AR
AR

High-grade XR LED display-P1.9, P2.6, P2.9

Indoor Small Pitch Mini LED Display-P0.9, P1.25, P1.56

LED Floor Display-P2.5, P2.6, P2.9, P3.9, P4.8,P5.2,P6.25

Extremely Thin 4k LED Display

Fine Pitch LED Display-P2.5, P2, P1.8

Interactive LED Display-P1.2, P1.5, P1.8

Indoor Fine Pitch LED Display-P1.86, P2.0, P2.5, P3.076

Indoor Fine Pitch LED Display

Innovative COB LED Display - P0.78 P0.93 P1.25 P1.56 P1.87

Innovative 4K COB LED Display

Indoor Fine Pitch COB LED Display

Macro High Definition COB LED Display

Indoor Fine Pitch LED Display P0.7, P0.9, P1.25, and P1.56

IP68 Outdoor Front Access LED Display

Outdoor Front Service LED Display-P5, P6, P6.6, P8, P10

IP68 Outdoor Front Service LED Display-P6, P8, P10

Indoor Fully Front Service LED Display - P1.9, P2.6, P2.9, P3.9

Outdoor Front Access LED Display-P4.7, P6.3, P9.5

Outdoor LED Display Screen-P3.9, P4.8, P6.2, P7.8, P10.4

DIP LED Display-P10, P16, P20

SMD Outdoor LED Display-P1.9, P2.6, P3, P4, P6, P8, P10

Die-casting Slim Type Outdoor LED Display-P4, P5, P6.6, P8, P10, P16

IP66 Outdoor Front and Rear Access LED Display

Outdoor Front and Rear Access LED Display P5.71, P6.67, P8 and P10

Cutting-edge Outdoor LED Display Technology Solution

Outdoor Rental LED Display-P2.9, P3.9, P4.8

Outdoor Rental LED Display-P3.9, P4.8, P5.9

High-quality Outdoor Rental LED display-P2.6, P2.9, P3.9, P4.8

Outdoor Rental LED Display-P3.9, P4.8, P5.9

Outdoor Rental LED Display-P2.9, P3.9, P4.8

High Quality Outdoor Rental Transparent LED Display

High Quality Outdoor Rental Transparent LED Display

Indoor LED Display-P2.5, P3, P4, P5

Indoor LED Panel for Rental-P2.6, P2.9, P3.9, P4.8

Indoor LED Panel for Rental-P2.6, P2.9, P3.9

Indoor LED Panel for Rental-P2.6, P2.9, P3.9

Indoor LED Panel for Rental-P2.6, P2.9, P3.9, P4.8

LED Curtain Display-P10.4, P12.5, P15.6, P25, P31.2

Media Facade LED Display-P12, P15, P25, P31, P50

Translucent LED Display-P1.9, P2.8, P3.9, P7.8, P10


Outdoor LED Display Banner-P2, P3, P4, P5

Indoor LED Display Banner-P1.8,P2.5

Indoor LED Display Banner-P1.8,P2.5

Shelf LED Display for Supermarket and Retail Stores


Spherical LED Screen for Indoor and Outdoor Advertising

Sept. 09, 2026< Back to list
A control room LED video wall should not be selected by comparing pixel pitch, resolution and refresh rate on a quotation sheet. The more important question is whether the display can show the information operators need to read, at the distance they actually sit, under the brightness and operating conditions they actually use.
For system integrators, engineering consultants and control room operators, the selection process should therefore be practical:
Measure the Room → Classify the Content → Translate Those Findings into Display Requirements → Verify the Complete System Under Realistic Operating Conditions
1. Start with Viewing Distance
The first measurement is not the wall size. It is the distance between the LED wall and the people who must read it.
Record at least three positions:
Closest critical viewing position: the nearest operator who must read detailed information.
Primary viewing position: where most operators normally work.
Farthest viewing position: the furthest location from which the wall must remain useful.
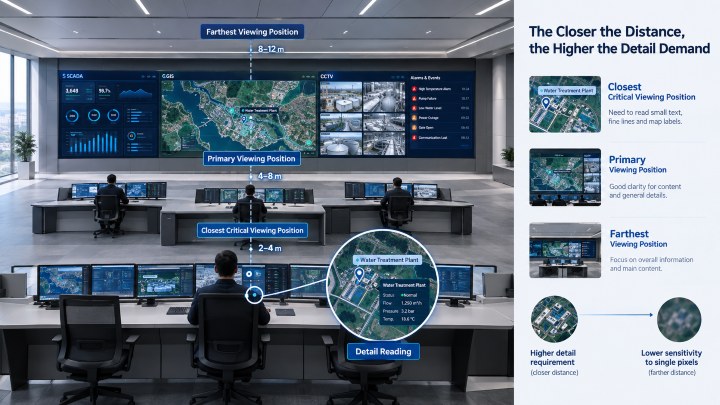
Why does this matter?
Pixel pitch determines how much physical pixel density the wall provides. If the pitch is too large for a close operator, individual pixels and fine details become harder to resolve. If the pitch is much finer than the room requires, the additional cost may deliver little visible benefit.
A practical starting range for data-heavy control rooms
For data-heavy control rooms, the initial pixel-pitch range can be estimated based on the closest critical viewing distance:
(1) Under 2 m: P0.9–P1.2
(2) 2–3 m: P1.2–P1.5
(3) 3–4 m: P1.5–P1.8
(4) 4–6 m: P1.8–P2.5
(5) Over 6 m: P2.5 and above
These ranges are starting points, not automatic specifications.
If the wall contains dense text, detailed GIS labels or small SCADA elements, evaluate the finer end of the range. If the wall is mainly used for large CCTV images or overview graphics, the coarser end may be sufficient.
The key rule is simple:
Use the closest position that requires detailed reading to establish the upper limit of acceptable pixel pitch—not the average room distance.
2. Match the Pixel Pitch to What the Wall Actually Displays
Viewing distance tells you where to start. Content determines how demanding the display needs to be.
Content type | Parameters that deserve priority | Why |
SCADA / dashboards / tables | Fine pixel pitch, grayscale, uniformity | Small text and thin lines must remain readable |
GIS / maps | Fine pitch, grayscale, color consistency | Labels, routes and low-contrast details can disappear at low brightness |
CCTV | Source resolution, pixel pitch, refresh rate, processing | Operators need to identify motion and details without scaling artifacts |
Alarm information | Contrast, text clarity, low-brightness performance | Critical information must remain visible without excessive brightness |
Video / training content | Refresh rate, color, motion handling | Motion quality matters more than extreme pixel density |
Mixed content | Pixel pitch + grayscale + processing | One wall must perform well across different signal types |
This is why “4K” should not be the final selection criterion.
A 4K processor or source does not mean every window receives 4K pixels. As more sources share the wall, each window gets fewer pixels.
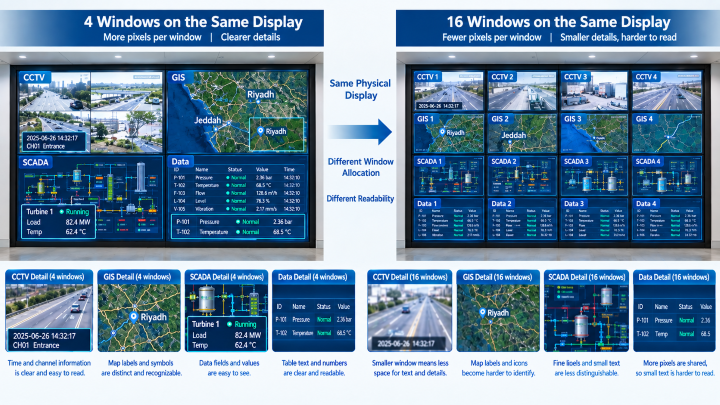
Planning test: Display the smallest required text in the intended layout and compare:
(1) 4 large windows → more pixels per window → better readability
(2) 16 small windows → fewer pixels per window → higher pixel-density demand
If text requires excessive scaling or window enlargement to remain readable, simply labeling the wall “4K” does not solve the problem.
3. Treat Screen Resolution as a System Result
For a control room project team, the more useful question is:
How many physical pixels will each critical application window actually receive?
That number should then be checked against the source resolution, window size, viewing distance, and minimum text size operators need to read.
For a control room, calculate the actual pixel dimensions of the finished LED wall.
Horizontal pixels = Screen width ÷ Pixel pitchVertical pixels = Screen height ÷ Pixel pitch
For example, a 4 m-wide, 2.25 m-high P2.0 LED wall provides approximately:
4,000 ÷ 2.0 = 2,000 horizontal pixels2,250 ÷ 2.0 = 1,125 vertical pixels
So the wall is roughly 2,000 × 1,125 pixels, not automatically a native 4K display.
The key question is:
How many physical pixels will each critical application window actually receive?
This should be checked against the source resolution and the minimum text size operators need to read.
4. Evaluate Image Quality at the Brightness Operators Will Actually Use
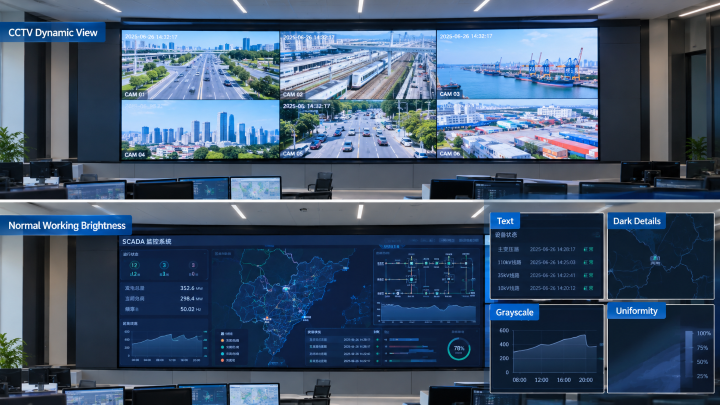
Test at normal operating brightness, not maximum brightness. Check grayscale, dark-scene detail, color consistency, uniformity, and text readability under actual room lighting.
Dynamic Content: Run CCTV or high-quality video to verify motion stability, color reproduction, refresh performance, and uniformity.
Data Content: Run dark SCADA/GIS content with small text, thin lines, gradients, warnings, and map labels. Ensure critical details remain readable at normal brightness.
Acceptance Principle: Evaluate the LED wall for information readability under real operating conditions, not maximum visual impact.
5. Design Redundancy Around Actual Failure Risks
For a mission-critical control room, “dual backup” is not a sufficient specification.
Break the system into four levels:
Power → Signal → Processing → LED Display
Then ask what happens when each level fails.
Failure | What should be checked |
Power supply failure | Does the affected area remain operational? Is switching automatic? |
External power interruption | Is UPS provided separately? How long can it support the system? |
Signal path failure | Is there an independent backup path? |
Processor failure | Can another processor take over? |
Module failure | Can the module be replaced without extended downtime? |
Replacement module | Can brightness and color be restored to match surrounding modules? |
This distinction is critical:
Redundant LED power supplies do not equal UPS protection.
Likewise, a backup signal that passes through the same processor is not a fully independent backup path.
For a high-risk control room, every shared component should be identified as a potential single point of failure.
6. Match Maintenance Design to the Installation Environment
Maintenance requirements should be decided before installation, not after a failure occurs.
If rear access is availableRear maintenance may be practical for a dedicated equipment room.
If the LED wall is against a structural wallFront maintenance becomes much more important because removing surrounding cabinets to reach one failed module can increase downtime.
Before approving the design, confirm:
Can individual modules be removed from the front?
Can power and signal components be accessed?
Can a replacement module be installed without removing adjacent modules?
Are spare modules pre-calibrated or calibration-ready?
What tools are required?
How is the repaired area verified?
The objective is measurable:
How long does it take to return one failed area to normal operation?
That is a more useful maintenance KPI than simply stating “front maintenance.”
7. Check the Control System Before Finalizing the LED Wall
The LED wall is only one part of the display chain.
Before selecting the processor, calculate the required processing capacity based on:
Number of sources × source resolution × simultaneous windows × required processing functions
For example, a project displaying multiple 4K cameras, GIS maps, and operator desktops simultaneously may require substantially more processing capacity than a wall displaying four fixed 1080p sources.
Also check:
Input/output compatibility
Scaling
Window switching
Latency
Frame synchronization
Signal distribution
Network architecture
Keep in mind: A 3840 Hz LED refresh rate does not automatically mean the complete system has low latency. Source equipment, processing, and signal transmission can still become bottlenecks.
8. LED vs LCD: Use the Room to Make the Decision
Consideration | LED | LCD |
Display layout | Large continuous visual canvas | Relatively small display areas |
Bezel lines | No conventional bezel lines | Visible bezels between panels |
Wall dimensions | Flexible wall dimensions | Better suited to standardized panel layouts |
Content type | Cross-screen maps, dashboards, and large-scale visualizations | Fixed content windows |
Control-room integration | Well suited to large-scale control-room workflows | Practical for conventional flat-panel workflows |
Best fit | Projects requiring a seamless, large-format display | Projects where fixed windows and visible bezels are acceptable |
The decision should therefore be based on the operating layout, not the assumption that one technology is universally better.
9. Turn the Measurements into a Project Decision
Before requesting a quotation, complete this short decision sheet:
Project finding | What it tells you |
Closest critical viewer: 2.5 m | Start evaluating around P1.2–P1.5 |
Dense SCADA/GIS text | Favor finer end of the pitch range |
16 simultaneous windows | Check pixels allocated to each window |
Dark-room operation | Prioritize low-brightness grayscale |
24/7 critical operation | Specify power + signal + processing redundancy |
Wall-mounted with no rear access | Require front maintenance |
Multiple 4K sources | Confirm processor and signal capacity |
Long maintenance response time unacceptable | Keep calibrated spares onsite |
This turns a vague requirement such as “We need a 4K control-room LED wall” into an engineering requirement that suppliers can actually quote against.
10. FAQ About Control Room LED Display
Q1. What pixel pitch is suitable for a control room?
Start with the closest position where operators must read detailed information. As a preliminary range, P0.9–P1.2 is worth evaluating below 2 m, P1.2–P1.5 around 2–3 m, P1.5–P1.8 around 3–4 m, and P1.8–P2.5 around 4–6 m. Dense text and GIS content may justify moving toward the finer end.
Q2. Does a 4K LED video wall guarantee readable control-room content?
No. The actual pixel allocation of each application window matters. A wall can receive a 4K source while individual windows contain far fewer pixels. Always evaluate the smallest critical content in the intended window layout.
Q3. What brightness should a control-room LED wall run at?
Do not select operating brightness from maximum brightness alone. Establish the target based on room lighting and operator comfort, then verify grayscale, text and uniformity at that brightness.
Q4. What redundancy does a control-room LED video wall need?
At minimum, review four layers: power, signal, processing and LED components. Identify the single point of failure at each layer and define the expected failover or repair response.
Conclusion
The right control-room LED video wall should be selected based on viewing distance, content, pixel pitch, brightness, processing, redundancy, and maintenance, not headline specifications alone.
Define these requirements before requesting quotations to compare suppliers on actual project needs.
Need a project-specific configuration? Send Premteco your room layout, viewing distance, display size, content types, and input sources for a tailored recommendation.
Flip-Chip vs Wire-Bond COB LED Displays: Key Differences
Flexible LED Displays: Applications and Buying Guide
LED Display Grayscale: Bit Depth and Image Quality Explained
How to Choose an Outdoor LED Billboard: Pixel Pitch, Brightness, IP Rating and Power Consumption
COB vs MIP for P0.9 LED Video Wall: Which Is Better?
Premteco: special-shaped screen to present a different
How does the LED display follow the 5G trend?
Premteco introduces new design rental screen
Premteco P8 Perimeter LED Screen for Stadium in Canada
Premteco P10 Outdoor Fixed LED Display in Australia
Premteco P1.5 Indoor Full Color LED Screen in Australia
Premteco P8 Outdoor LED Trailer Screen in Australia
Premteco P2.5 Indoor LED Banner Screen in Australia
Premteco P4.8 outdoor LED screen in Qatar
Premteco P1.9 Indoor HD LED screen in Kuwait
Premteco P3.9 Outdoor Rental LED Display in Austria